NGS - S01E01 - World Tour winners 2025
Like in previous years, this article takes a closer look at the
Division 1 champions of the season. Using a
bump chart of all Division 1 winners, we can follow their placement trends throughout the season and see which teams dominated consistently, which peaked at the right moments, and which relied on short but explosive phases.
This format is not meant to be a pure leaderboard recap. Instead, it combines raw season statistics with narrative context. Race volume, win rates, Grand Tour success, monument wins, average rankings, and total points are all viewed together to create a more complete picture of what kind of season each champion actually had.
This World Tour winners review also marks the start of
Season 1 of the “Next Gen Stats” series, which will focus on general statistics, yearly snapshots, team comparisons, and long-term trends across the game.
With that said, let’s dive into the numbers and take a closer look at how the
Division 1 champions of 2025 actually performed.
#1 Tukhtahuaev - The title hamster
Division 1 Titles:
6
Races:
351
Wins: 81
Win Percentage: 23.1%
Monuments: 1 (Lom)
Grand Tour Wins:
3
Stage Race Wins:
11
Avg. Rank:
2.8
Total Points Collected:
86,133
Avg. Points Per Race:
245.4
Avg. Points Per Season:
13,342
Highlights: Impressive year for Murodbek Makhamadzhonov winning the GT tripple, Lombardia and much more
A team and riders’ names to break your tongue – but what a year. The first Division 1 title in the team’s history was already secured in January 2025. But Tukhtahuaev didn’t stop there: five more titles were added throughout the season.
Tukhtahuaev was the clear master of the big races in 2025. His climber Murodbek Makhamadzhonov, aka
Voldemort, had a nearly perfect year. Not only did he win the GT triple, but also 6 tours in total (including Suisse, Romandie, Catalunya, and Andes), the monument Il Lombardia, the San Sebastian classic, and an incredible 15 GT stages.
Murodbek alone would have been enough for first place in my ranking. He achieved most of the team’s success – if not all of it. He was clearly the main focus of the team. In other classics, Tukhtahuaev was missing a bit of luck, but even there the team still managed six podium placements through other riders.
In total, 23 riders of the team earned at least one palmarès entry. Tukhtahuaev also won a TTT and nine team classifications (including the Tour and the Vuelta). Tuk scored the most points overall (86,133) and had the highest points average (245.4) among all Division 1 champions.
They were also the most consistent team, finishing in the Division 1 top 3 for ten months in 2025, with an average rank of 2.8. On top of that, Tukhtahuaev was the most active team among the Division 1 champions. Impressive.
Clearly a well-deserved #1 in my ranking.
#2 Bugatti - The team is the star
Division 1 Titles: 2
Races: 349
Wins:
84
Win Percentage:
24.1%
Monuments:
2 (Lom, MSR)
Grand Tour Wins: 0
Stage Race Wins: 9
Avg. Rank: 3.4
Total Points Collected: 80,809
Avg. Points Per Race: 231.5
Avg. Points Per Season: 12,900
Highlights: Winning 2 monuments in one year
It was a close call between Bugatti and Pokemonogatari for second place in my ranking, and I can totally understand if people rank them differently (you can make your personal ranking in the
discussion thread). The decision to place Bugatti at #2 was mainly driven by their constant scoring. Similar to Tuk, Bugatti had only two months all season where they finished outside the Division 1 top 3.
Bugatti also scored over 80k eternal points in 2025 and had the highest winning percentage among the Division 1 champions. With 131 palmarès entries, Bugatti leads this statistic among all Division 1 champs (and most likely overall).
Unlike Tukhtahuaev and Pokemonogatari, Bugatti does not rely on a single rider for most of its success. Instead, it fields a very strong all-round team that can compete in nearly every type of race. The main focus of the team was clearly on stage races, and that approach was very successful. Three GT podiums with two different riders is already strong, 20 GT stage wins is fantastic, and on top of that they won a team classification and a sprint jersey (both at the Vuelta).
Still, missing a GT overall win is the small imperfection in an otherwise outstanding year. Bugatti also claimed two monuments (Il Lombardia and Milano–Sanremo), finished on the podium at Paris–Roubaix, won the Cyclassics, and added four more podiums in other classics.
#3 Pokemonogatari - One for all, all for one
Division 1 Titles: 3
Races: 346
Wins: 69
Win Percentage: 19.9%
Monuments:
2 (LBL, RV)
Grand Tour Wins: 2 (Tour, Vuelta)
Stage Race Wins: 6
Avg. Rank: 11.8
Total Points Collected: 65,430
Avg. Points Per Race: 188.5
Avg. Points Per Season: 9,961
Highlights: Ryomen Sukuna becoming the rider with most eternal points all time.
Who the fuck is Fring? Ryomen Sukuna, aka
The King of Curses, is the man who took the record for most eternal points from Alejandro Velasco.
After the 2024 campaign for the eternal points record was delayed due to time issues on the manager side, Poke came back in 2025 with exactly this goal in mind. And once again, he was extremely active: 346 races ridden, a Giro win, and two monuments (Liège–Bastogne–Liège and Ronde van Vlaanderen), plus classic wins like Amstel Gold Race and Milano–Torino, and many more podiums across GTs, monuments, and classics.
The three Division 1 titles were won consecutively between April and June. Towards the end of the year, however, the success faded. Part of that was due to Poke fully concentrating on the eternal points record for a very old Ryomen. He even got relegated to Division 2, which resulted in a comparatively poor average rank of 10.4, despite still scoring 65,430 eternal points.
The three Division 1 titles and the GT win kept him firmly in the discussion for #2, but I personally value consistency more than short peak phases. Nevertheless, Poke still managed to win 10 GT stages and led the King of Curses to the all-time eternal points record – which ultimately earns him a well-deserved #3.
#4 Hansa - Late to the party
Division 1 Titles: 1
Races: 343
Wins: 52
Win Percentage: 15.2%
Monuments: 0
Grand Tour Wins: 2 (Tour, Vuelta)
Stage Race Wins: 7
Avg. Rank: 11.8
Total Points Collected: 65,430
Avg. Points Per Race: 190.8
Avg. Points Per Season: 10,511
Highlights: 3 GT podiums, 2 GT wins
Hansa was nearly late to the party. Starting the season in Division 2, he even dropped down to Division 3 in January, before making his way back to Division 1 by April. From there on, the rankings kept getting better the longer the year lasted, ultimately ending with a Division 1 title in December.
Traditionally, Hansa is strongest late in the season, with a clear focus on climber-leaning stage races. He usually scores big points at Andes and the December Tour. But even during the real cycling season, he was highly successful at the GTs: winning the Tour de France and the Vuelta with two different riders, finishing second at the Giro, and collecting 11 GT stage wins.
There was no monument win or podium for Hansa in 2025, but he still managed to win three classics (Cyclassics, Amstel Gold Race, and Gran Piemonte) and add one more podium in that category.
Hansa always operates with a very small team. Only 13 riders collected a total of 93 palmarès entries. Even more impressive, he still manages to secure a Division 1 title year after year. That consistency earns him my #4.
The Suspended
Last year, a total of eight teams won at least one Division 1 title. In 2025, only Hansa and Pokemonogatari managed to re-enter the Division 1 champions statistics.
The team
Alive And Dead, responsible for ten Division 1 titles over the last four years, was effectively buried in 2025. The new team
Wiener Zentralfriedhof RV is on the way back up, but with a different focus and very likely no longer playing a major role in the fight for Division 1 titles.
Crazy Vikings turned into a frequent visitor of Divisions 2 to 4. One highlight of their season was winning the classics in Quebec and Montreal.
RideforMoney started the year in Division 6 and only restarted active play towards the end of May. The team managed to reach Division 1 again for the November season, but without any major highlights in 2025.
Alkworld was quite active in terms of race volume in 2025, but never played a significant role in the Division 1 title fight and instead became an elevator team between Division 1 and Division 2. Still, Alkworld won Paris–Roubaix and five other classics, and also finished second and third at Milano–Sanremo and Liège–Bastogne–Liège.
r TAKA had just three classic wins in 2025. Most will remember the season for
not winning the Giro with Baptiste Firiam (90 mountain, 57 TT).
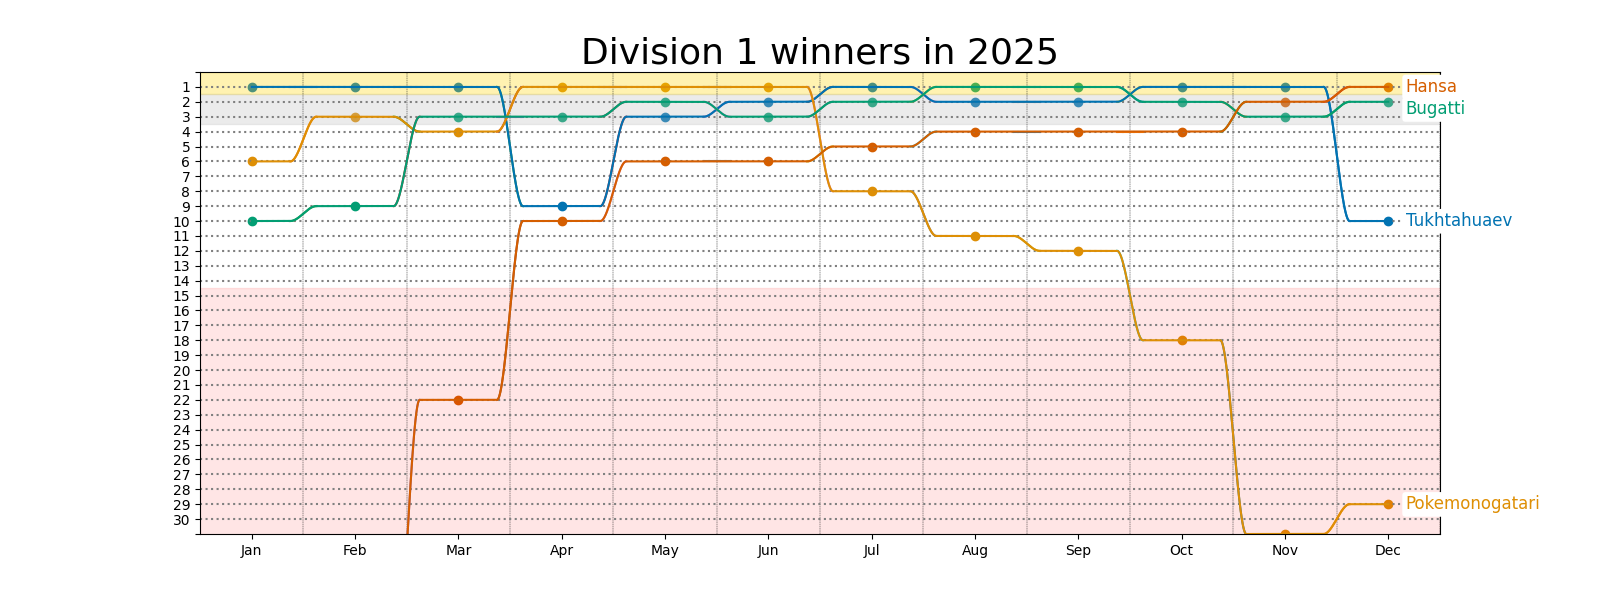
- division_winners_2025.png (136.45 KiB) Viewed 260 times
*Stage wins may differ from the in-game statistics. Our analysis includes wins in TTT and national championships
